What this does
The Comparison Results page is where every comparison lands. It opens when you press Compare Selected on Compare Degrees, Compare Careers or Compare Non-Degree Paths, and lays your picks side by side: a short list of which pick leads on what, charts of pay and cost, one table with every number, and, for degrees and careers, the top universities for each pick with links into the ROI calculator.
Each pick keeps the same colour everywhere on the page: in the charts, and as a coloured dot beside its name in the table. That makes it easy to follow one option from chart to chart.
It helps a student see the trade-offs between options at a glance, a parent check the cost side as well as the pay side, and a counselor walk through the numbers with a family, or print them.
Before you start
- Make your picks first. This page is built from the picks in its address. You reach it from one of the three picker pages; see Compare careers, Compare degrees and Compare non-degree pathways.
- Keep the same state. The page uses the state in Showing data for. Without a state it shows Pick a state to see this comparison. If you change state here, the same picks are looked up again in the new state, and some may have no data there.
- Give it a moment. While it works, the page shows Loading comparison data… under the title and Fetching comparison data — this may take a moment on first load… in a card. The university lists load a little after the rest.
Step by step
- Press Compare Selected on a picker page. The results page opens with the eyebrow Samantar · Comparison Results and a loading card.
- Read the title and the line under it. The title says what was compared: Career Comparison, Undergraduate Degree Comparison, Graduate Degree Comparison, Degree Comparison (a mix of levels) or Non-Degree Pathway Comparison. The line lists your picks: "Comparing 3 careers: … · … · …".
- For careers, look at AI Outlook (per career) at the top: each career's name with its tag, in the same order as the table. Hover over a tag (or tap and hold) to read its short explanation.
- Read At a Glance. Each badge names the pick that leads on one measure, such as Highest Median Salary.
- Scroll through the charts: Salary Comparison, 20-Year Salary Trajectory, and, depending on what you compared, Cost & Break-Even, Path Efficiency and University Availability. Hover over a bar or line to see its exact value. Click a name in a chart's legend to hide or show that series.
- In Full Comparison, click a column heading to sort by it. Click it again to reverse. A ▲ or ▼ marks the sorted column.
- For careers, click Calculate ROI → in a row. The page jumps to that career's top three universities.
- In Top ROI Universities, read each pick's two short lists, By outcome measures and By Institution Rank. Click ⓘ Show institution insights under a school to open a small panel of facts about it; the link changes to ⓘ Hide insights.
- Click Open in ROI calculator under a school. The ROI calculator opens with that school, the program and its level already filled in (and, for careers, the career). Choose any remaining inputs and press Run 20-Year Projection there.
- To change your picks, press ← Modify Selection beside Full Comparison. It takes you back to the picker page you came from.
- To keep the comparison in My Reports, click ☆ Save this report, the floating button at the bottom right. It turns to ★ Saved. If you are signed out, the same button reads Sign in to save and opens the sign-in dialog instead.
- To keep a copy on paper or as a file, press Save as PDF in the bottom-right corner and save or print from your browser's dialog. You can also bookmark the page: its address holds your picks.
Every control explained
| Control | Where | What it changes | Default | Tips |
|---|---|---|---|---|
| Showing data for | Above the title | The state whose wages, costs and universities are used. Changing it reloads the page with the same picks in the new state. | The state you compared in | Some picks may have no data in another state; the page then shows fewer items or an error. |
| AI Outlook (per career) tags | Top of the results, careers only | Nothing; each career's name is followed by its AI outlook label, and hovering over the label shows its short rationale. | One named tag per career | The tags are in the same order as the table and charts. A career with no rating is left out; if none has one, the block does not appear. |
| Chart legends | Above Salary Comparison, 20-Year Salary Trajectory and Cost & Break-Even | Click a legend entry to hide or show that series (for example only Median Salary bars). | All series shown | Single-measure charts (Path Efficiency, University Availability) have no legend; their bars are labelled by name. |
| Chart hover | Every chart | Shows the exact value under your pointer; on the 20-year chart, every pick's value for that year at once. | — | On a phone, tap a bar or a point. |
| Sortable column headings | Full Comparison table | Sorts the rows by that column, low to high; a second click sorts high to low. Break-Even and Time To Entry sort by their number of years or months (Year 5 before Year 12), with Immediate counted as zero. Rows with "—" stay at the bottom. | The order the page first draws | Hover over ROI Efficiency (and, for careers, ROI Calculator) to read what the column means. On a narrow screen each row becomes a card with labelled values. |
| Calculate ROI → (careers) | Last column of the careers table | Jumps down the page to that career's Top 3 universities, where each school links into the calculator. | — | Not shown when the feeder filter was Non-Degree, because there are no university lists then. |
| Open in ROI calculator | Under each school in Top ROI Universities | Opens the ROI calculator with the school, program and level filled in; from a career list, the career too. | — | Graduate programs open at the graduate level (fixed in version 1.9.3). A school with no clear program level has no link. |
| ⓘ Show institution insights / ⓘ Hide insights | Under each school in the university lists | Opens or closes a small panel of facts about the school (see Reading the results). | Closed | The first opening shows Loading… briefly, then the facts; reopening it is instant. Only if the site cannot be reached at that moment does the panel say Insights not available right now.; close it and try again. |
| ← Modify Selection | Right of the Full Comparison heading | Goes back one page in your browser, to the picker you came from. | — | Your earlier ticks may or may not still be there, depending on the browser; tick again if the list is empty. |
| ← Go back and try again | In the error card, when something went wrong | Goes back one page, like ← Modify Selection. | Hidden unless there is an error | Pick different items or check the state, then compare again. |
| Save as PDF | Bottom-right corner | Opens the browser's print dialog. The printout carries a light "samantar.us / NOT FOR COMMERCIAL USE / FOR PERSONAL USE ONLY" watermark. | — | Choose "Save as PDF" as the printer to get a file. |
| ☆ Save this report / Sign in to save | Bottom-right corner, above Save as PDF | Signed in: saves this comparison to the ⚖️ Compare section of My Reports and turns to ★ Saved; clicking ★ Saved removes the save. Signed out: reads Sign in to save and opens the sign-in dialog on the same page. | Shown as soon as the page opens; reads ★ Saved if this exact page address is already saved | The save keeps the page address with your picks and state, under the title Comparison Results. Up to 5 comparisons; when the section is full the site offers to open My Reports. See Saved reports. |
Reading the results
Money is shown in whole dollars per year ("$NN,NNN"); chart axes shorten it to thousands ("$NNk"). Percentages are whole numbers. A ratio shows as "N.NN×". Any missing value shows as "—", and a table column with no value for any pick is hidden.
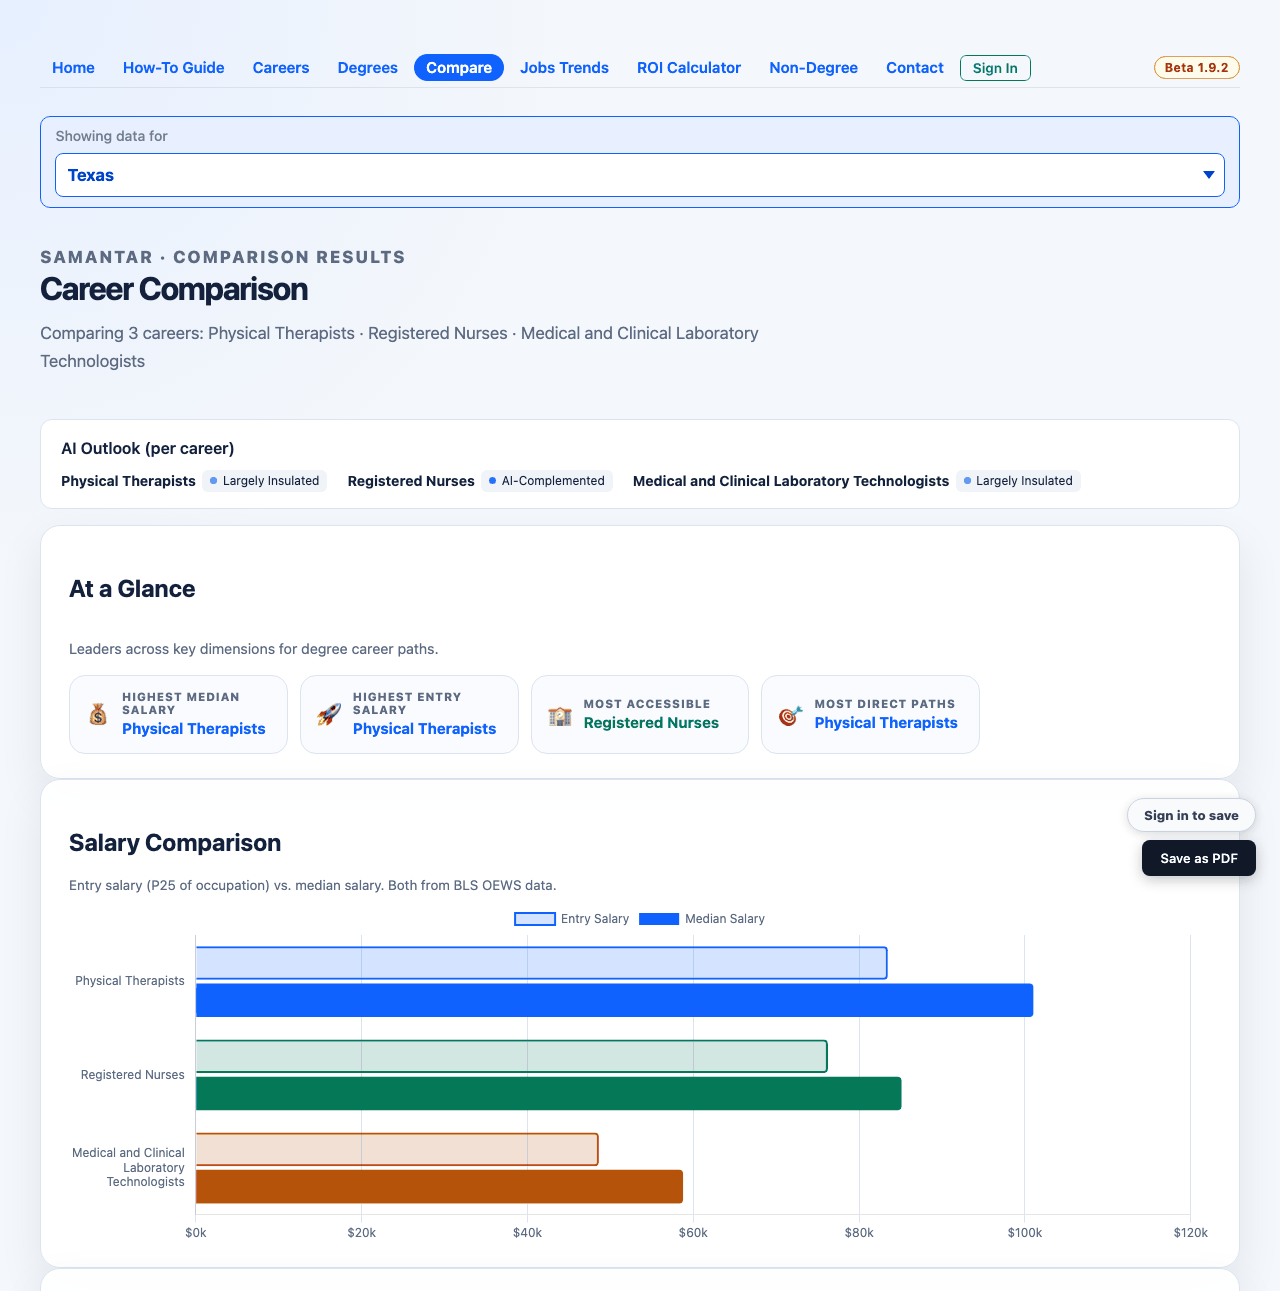
At a Glance
A row of badges, each naming the pick that leads on one measure, in that pick's colour. The line under the heading says what was compared, for example Leaders across key dimensions for the selected non-degree pathways. For careers it names the Feeder degree type you compared on: "degree", "all", "undergraduate", "graduate" or "non-degree" career paths. On a tie, the badge goes to the pick listed first in the table as the page first draws it. For the "Highest" badges a missing value counts as zero; a "Fastest" or "Lowest" badge is left out when no pick has a value.
| Comparison | Badges | How each leader is chosen |
|---|---|---|
| Careers | Highest Median Salary, Highest Entry Salary, Most Accessible (Most Path Options with the Non-Degree filter), Most Direct Paths | Highest median wage; highest entry wage; most universities with a program leading to the career (with Non-Degree: most pathways); highest share of direct routes. |
| Degrees | Highest Median Salary, Highest Entry Salary, Best ROI Efficiency, Most Universities Offer | Highest median career pay; highest entry pay; highest pay-to-yearly-cost ratio; most universities offering it. |
| Non-degree pathways | Fastest Cost Recovery, Highest Median Salary, Highest Entry Salary, Lowest Direct Cost | Fewest break-even months; highest median pay; highest entry pay; lowest direct cost. |
There is no overall winner badge. The page does not combine the measures into one verdict.
Charts
| Chart | Shown for | What it shows | Unit | How it is computed |
|---|---|---|---|---|
| Salary Comparison | All | Two bars per pick: Entry Salary (pale) and Median Salary (solid). | Dollars per year | The same entry and median values as the table (see the columns below). The note under the heading says which: for careers Entry salary (P25 of occupation) vs. median salary. Both from BLS OEWS data. |
| 20-Year Salary Trajectory | All | One line per pick, years Yr 1 to Yr 20. | Dollars per year | A simple model, the same for every pick: pay rises in a straight line from entry pay to median pay over 7 years, then grows 2.5% a year. If one of the two values is missing, the other is used for both. It is not a forecast for a person. |
| Cost & Break-Even | Non-degree pathways | Bars for Direct Cost (left axis) and a line for Break-Even (Months) (right axis). | Dollars; months | The pathway's direct cost and the months until it is paid back (see Break-Even below). Lower is better on both. |
| Path Efficiency | Careers, degrees, non-degree pathways | Careers: Share of direct pathways — no additional degree required beyond what's selected. (with Non-Degree: share of direct-entry routes). Degrees: Share of career paths reachable directly from this degree — no additional degree required. Pathways: Time to entry for each pathway in months. | Percent; months for pathways | The Direct Path %, Direct Paths or Time To Entry value from the table. A zero shows as a small stub so you can tell it from a missing bar. |
| University Availability | Careers, degrees | Careers: number of universities in your state with programs that lead to the career (with Non-Degree: number of pathway options). Degrees: number of universities in your state that offer the degree. | Count | The Feeder Universities / Available Paths or Universities value from the table. |
Full Comparison: careers
Note above the table: ROI Efficiency = median salary divided by total education cost (tuition multiplied by years). Higher is better because it means stronger earnings relative to the total cost required to reach that career path.
| Column | Meaning | Unit | Source and year | How it is computed |
|---|---|---|---|---|
| Career | The career, with its colour dot, and under it the route you ticked ("Undergraduate path", "Graduate path" or "Non-Degree path"). A career ticked on two routes has a row for each, named with its route in the charts and badges, for example "Registered Nurses (Graduate)". | — | BLS occupation titles | Each row's figures are for its own route. |
| Median Salary | The middle yearly wage for the career in your state. | Dollars per year | BLS OEWS, May 2024 | The median wage, taken across the routes into the career that match your feeder filter. |
| Entry Salary | A typical starting wage. | Dollars per year | BLS OEWS, May 2024 | The 25th-percentile wage: a quarter of workers earn less. |
| Feeder Universities (Non-Degree: Available Paths) | How many universities in your state have a program that leads to the career; with Non-Degree, how many pathways lead to it. | Count | NCES IPEDS programs and the site's degree-to-career map | Distinct universities (or pathways) on routes of the chosen kind. |
| Direct Path % | The share of routes that need no further degree after the program (with Non-Degree: routes with no formal training period). | Percent | Degree-to-career map | Direct routes, and licensed routes that need no further degree, divided by all routes. |
| Avg Extra Yrs | Extra years of education usually needed after the program to reach the career. | Years, one decimal | Degree-to-career map | The average over routes; with Non-Degree, the average months to entry divided by 12. |
| ROI Efficiency | Pay compared with the full cost of the education to reach the career. | Ratio ("N.NN×") | BLS OEWS wages; College Scorecard in-state tuition and books | Median wage divided by yearly direct cost times the total years of education, worked out route by route; the middle value is shown. With Non-Degree: divided by the pathway's direct cost. |
| ROI Calculator | Calculate ROI → link to the career's university list. | — | — | Hidden with Non-Degree. |
Full Comparison: degrees
Note above the table: ROI Efficiency = median career salary divided by median annual direct cost (tuition + books). Higher is better because it means stronger earnings relative to what the degree costs each year.
| Column | Meaning | Unit | Source and year | How it is computed |
|---|---|---|---|---|
| Degree | The field of study, with Undergraduate or Graduate underneath. In a mixed comparison each row shows its own level. | — | NCES IPEDS | — |
| Median Salary | Typical mid-career pay in the careers the degree leads to. | Dollars per year | BLS OEWS, May 2024 | For each school's program, the average median wage of its careers; then the middle value across schools. |
| Entry Salary | Typical starting pay in those careers. | Dollars per year | BLS OEWS, May 2024 | Same, with entry wages. |
| Median Annual Cost | A typical year's direct cost. | Dollars per year | College Scorecard, current release | In-state tuition plus books at each school offering it; the middle value. |
| Universities | Universities in your state that offer the degree at that level. | Count | NCES IPEDS programs | Counted among schools with published tuition. |
| ROI Efficiency | Pay compared with one year's cost. | Ratio ("N.NN×") | As above | Median career pay divided by yearly direct cost, school by school; the middle value is shown. |
| Direct Paths | Share of the degree's careers you can enter without another degree. | Percent | Degree-to-career map | Average over the schools offering it. |
Full Comparison: non-degree pathways
Note above the table: Break-even months = time to entry plus the months of entry-level earnings needed to recover direct out-of-pocket training cost. Paid academies and zero-cost routes can show immediate break-even.
| Column | Meaning | Unit | Source and year | How it is computed |
|---|---|---|---|---|
| Pathway | The route, with its tier name and provider (or career) underneath. | — | See the tier table | — |
| Median Salary / Entry Salary | The career's middle and 25th-percentile wage in your state. | Dollars per year | BLS OEWS, May 2024; Texas licence and academy routes use their own Texas pay data | Looked up for the career the route leads to. |
| Direct Cost | Out-of-pocket cost of the training. | Dollars | College Scorecard tuition and books; Texas licensing costs | Zero for direct-entry, on-the-job and paid-academy routes. |
| Break-Even | Months until the training cost is paid back. | Months ("N mo"), or Immediate | Computed | Months of entry pay needed to cover the cost, plus the months of training (not added for paid training). |
| Time To Entry | Months of training before you can start the job. | Months, or Immediate | Program length or required training hours | From the program's typical length, or training hours divided by 160. |
| Paid Training | Whether you are paid while you train. | Yes / No | Pathway data | Yes for paid academies and for Texas licence routes filed under tier 5. |
Top ROI Universities
For careers and degrees, one block per pick, titled "name — Top 3 universities". The note says Top 3 … universities for each selected career, listed by outcome measures: earnings, completion and cost. (or "each selected degree"), naming your state. Each block has two columns:
- By outcome measures: the first three universities on the site's list for that career or degree, which is ordered by outcome measures: earnings, completion and cost.
- By Institution Rank: the three best-ranked of the universities on that list by Institution Rank, a published outside ranking. The note above the column says: Institution Rank uses a 3-source composite: Washington Monthly overall, College Scorecard outcomes (completion, retention, earnings, Pell access, net price), and IPEDS faculty salary + endowment — applied to every state. Schools not in the ranked dataset are omitted from this list. If none of the schools is ranked, it says No publicly ranked institutions available for this degree.
Each school shows a position number (#1 to #3) within its column, its name and city, Open in ROI calculator, a line "Efficiency N.NN×" (that school's pay-to-cost ratio for this career or degree, computed as in the table; left out when the school's cost or the pay is not published), and ⓘ Show institution insights. Empty or failed blocks say No university pathways available for this career., No university offerings available for this degree. or ⚠ Could not load university rankings — …. Non-degree comparisons have no university lists.
Institution insights panel
Opened from ⓘ Show institution insights. It can show the tags HBCU, Hispanic-Serving and Online-only, and these rows when the school reports them: Acceptance rate, Median earnings 5 yrs after grad, Median debt at graduation, Loan repayment rate (5 yrs), First-time full-time retention, Student-faculty ratio, Instructional faculty (count), Undergrad enrollment and Endowment assets (large amounts shortened, for example "$NNk" or "$N.NM"). Footer: Sources: U.S. Dept of Education College Scorecard + NCES IPEDS, latest published. A school with none of these shows Institution insights not yet available for this school.; one that has left the federal data shows This school is not in the latest federal College Scorecard release.
Disclaimer card
The last card says: All salary projections are modeled from historical BLS/OEWS wage data and do not guarantee future individual outcomes. The 20-year trajectory uses a simplified linear ramp from entry to median salary over 7 years, followed by 2.5% annual growth — actual earnings will vary based on location, experience, employer, and economic conditions.
Error messages
| Message | What it means |
|---|---|
| No degree data found for the selected options | None of the degrees you picked has data at that level in the current state. Usually seen after switching state on a saved or shared comparison. |
| No data returned for the selected degrees. They may not be available for the chosen level. | The same for a comparison that mixes undergraduate and graduate picks: no pick at either level has data. |
| No matching careers found for comparison / No career data returned. The selected careers may not have enough data for comparison. | None of the careers has data for the feeder filter you used in this state. |
| No matching non-degree pathways found for comparison / No non-degree pathway data returned for the selected comparison. | None of the pathways exists in the current state's data. |
| No careers selected. Please go back and choose at least one career. (and the same for degrees and pathways) | The page address holds no picks. |
| Unknown comparison mode. Please go back and try again. | The address is incomplete or was edited. |
Each error shows in a card with a ⚠ and ← Go back and try again. If only some of your picks have data, the page shows those and leaves the rest out without a message; compare the line under the title with what you ticked.
More on sources: how the figures are produced.
Worked example
A parent in Ohio compares three careers for a teenager who likes science: registered nurse, physical therapist and medical laboratory technologist, with Feeder degree type on Degree.
- The page opens as Career Comparison, "Comparing 3 careers: …". The AI Outlook block at the top names each career with its tag, in the table's order; hovering over a tag shows a sentence about how AI may change that work.
- At a Glance names one career under each badge. One may win Highest Median Salary while another wins Most Accessible, because more Ohio universities offer programs that lead to it.
- Salary Comparison shows a pale entry bar and a solid median bar for each career, in thousands of dollars. On the 20-Year Salary Trajectory, the three lines climb until year 7 and then rise gently; a line that starts low but ends high marks a career with a large gap between entry and median pay.
- Path Efficiency shows what share of each career's routes need no further degree. A career that usually needs a doctorate after a bachelor's shows a lower share, and its Avg Extra Yrs in the table is higher.
- The parent sorts the table by ROI Efficiency by clicking the heading twice, so the highest ratio is on top, then clicks Calculate ROI → in the nurse row. The page jumps to the nursing career's "— Top 3 universities" block.
- The parent opens ⓘ Show institution insights under one school to see its acceptance rate and median debt, then clicks Open in ROI calculator. The calculator opens with the school, the nursing program, the undergraduate level and the nursing career filled in, ready to run.
- Back on the comparison, the parent presses Save as PDF to keep a copy for a meeting with the school counselor.
- The parent is signed in, so the button above it reads ☆ Save this report. One click turns it to ★ Saved, and the comparison appears under ⚖️ Compare in My Reports, ready to reopen with the latest data while that sign-in lasts.
Common questions
- Why does a value show "—"?
- The data behind it is missing for that pick in your state: for example no published wage for the career, or no published cost for the schools. If a column is "—" for every pick, the table hides it.
- Is there an overall winner?
- No. The page shows only measure-by-measure leaders in At a Glance. Which measure matters most is your call.
- Are costs in-state or out-of-state?
- In-state. Comparisons use in-state tuition plus books. To see out-of-state costs at one school, open it in the ROI calculator.
- Why does the 20-year line look so smooth?
- It is a simple, shared model, not a forecast: a straight climb from entry to median pay over 7 years, then 2.5% a year. It shows the shape of the gap between options, not what any person will earn.
- Why are there no university lists for my non-degree comparison?
- Non-degree routes do not go through a university, so there is nothing to list. The same applies to careers compared with the Non-Degree filter.
- Why does a career or degree I ticked not appear?
- It has no data for the chosen level or filter in this state. The page shows the picks that do have data and drops the rest.
- Why is a career missing from AI Outlook?
- It has no AI outlook rating yet. The other careers keep their tags, in the same order as the table.
- Can I save a comparison to My Reports?
- Yes. Click ☆ Save this report at the bottom right; it lands in the ⚖️ Compare section, up to 5 comparisons. Signed out, the button reads Sign in to save and opens the sign-in dialog; after you sign in, the button reads ☆ Save this report without a reload, and an email link brings you back to this comparison. When you come back to a comparison you already saved, the button reads ★ Saved; clicking it removes the save. A saved comparison keeps the page address, so it reopens with the latest data. You can also bookmark the page or use Save as PDF.
- Do the graduate calculator links work?
- Yes. Since version 1.9.3, Open in ROI calculator opens graduate programs at the graduate level.
What this does NOT do
- It is not a job board or an admissions tool.
- It is not advice and does not pick a winner for you. The badges lead on one measure each.
- All pay, cost and break-even figures are estimates from historical data, not guarantees. The 20-year line is a simple model.
- It stores nothing about you. Your picks live in the page address. Sign-in is only for saving reports to My Reports.
- It uses in-state costs only, and leaves out scholarships and aid. Living costs are left out too.
- It does not mix kinds: degrees, careers and pathways are compared only with their own kind.
Related
- Compare: picking a mode
- Compare careers, Compare degrees and Compare non-degree pathways
- ROI Calculator — what happens after Open in ROI calculator.
- Saved reports
- Privacy and limits
- Live pages: Compare, ROI Calculator.