What this does
The ROI Calculator answers one question: if you earn this degree at this school and go into this career, how long until the extra pay covers what the degree cost? You pick a school, a degree program and a career. The calculator then lays out 20 years, side by side: your money with the degree, and your money if you had gone to work instead.
The result is a year-by-year table, two line charts and a break-even year: the first year in which the extra earnings from the degree have paid back the cost of the degree. You get that year twice, once in plain dollars and once after inflation.
It helps:
- Students who want to see whether a program pays back, and how fast, before they apply or borrow.
- Parents who want to test the cost side: in-state or out-of-state tuition, savings and scholarships, a bigger or smaller loan, a longer repayment term.
- Counselors who want to put two or three options through the same assumptions, or show a student how much a career choice, not just a school choice, moves the answer.
Everything is an estimate built from public data. It is a way to ask better questions, not a forecast of your own life.
Before you start
- Pick your state. The calculator needs a state. If none is chosen, the page shows a prompt to pick one in Showing data for at the top of the page. Pick the state where the school is. The school list, the degree search, the city rent tables, tuition and wages all follow that choice. The page text uses your state's name: for example, the residency option reads your state's name followed by resident (in-state).
- Have a school or a degree in mind. You can start from either. If you only know the subject (nursing, accounting), start with the degree search and let it show you which schools offer it.
- Know whether you will pay in-state or out-of-state tuition. This is the biggest single cost switch on the page.
- Have rough numbers ready for savings or scholarships, and any money you expect to earn during school. They are optional; the calculator runs with zeros.
- Only schools with published in-state tuition appear in the school list. If your school is missing, it may be on Schools without tuition data.
- You do not need an account. Signing in is only for saving a run to My Reports. See Saved reports.
Step by step
The page is a form in four numbered steps (with an extra step for graduate programs), then the results below it.
- Under Study Plan (Step 1), set Degree level to All, Undergraduate or Graduate. This narrows the programs you will see later.
- Optionally set University type (Public, Private, Community College, For Profit). The school list below shrinks to match.
- Set Residency: in-state (your state's name followed by resident (in-state)) or Out-of-state / non-resident.
- Choose a school. Either click in University and type part of its name (a dropdown of up to 30 matches opens; click one), or click a school's tile in the Universities list. Each tile shows the name, city and school type. Once you pick, the list collapses to your school and Step 2 opens.
- Or, instead of steps 4 and 5, type at least two letters of a subject in the degree search box (Or search by degree across all … universities, with your state's name). A dropdown lists matching programs, each with its school and city. Click one: the calculator selects that school and that program for you and goes straight to Step 3.
- Under Degree Program (Step 2), find your program in the list of chips, or narrow it with Search programs offered at this university. Each chip shows the program name, its credential level and how many people graduate from it a year. Click the chip.
- If you picked a master's or doctoral program, a Prior Education step (2½) appears. Leave Graduate degree only selected, or choose Stack with a … undergrad degree — show combined ROI and pick the earlier degree (see the controls table).
- Under Career / Occupation (Step 3), wait for Computing outcomes… to finish. Careers this program leads to appear in up to four tables, each with median and entry pay. Click Drill down → on the career you want.
- Outcome Overview (Step 4) opens with the career's pay, its pathway, its projected growth, the AI Outlook, and the school's annual tuition. The career list in Step 3 folds away; + Show list brings it back.
- In the Financing box, enter Own savings / scholarships ($), change Loan repayment term (years) if you like, and add any In-school earnings. Leave Manual tuition loan (blank = auto) empty to let the calculator size the tuition loan. Living costs during school that your earnings and savings don't cover are borrowed on top of it.
- In the Living Expenses box, keep Include living expenses, choose a Rent (during school) option and a Living expenses (food, transit, etc.) level, and optionally pick a During-school city and Post-graduation city. The Monthly total (rent + living): line updates as you go.
- In the Assumptions box, pick a Scenario and adjust Annual raise (%), Promotion bump (%) and Promotion years if you want.
- Click Run 20-Year Projection. The button reads Calculating… while it works. The results appear below the form and the page scrolls to them.
- Read Incremental ROI Summary first: it holds the break-even year for each scenario. Then open Scenario Comparison and Year-by-Year Breakdown for the detail.
- To try a change, edit any input and click Recalculate (in the Assumptions Used card) or Run 20-Year Projection again.
- To keep the run in My Reports, click ☆ Save this report at the bottom right. It turns to ★ Saved. If you are signed out, the same button reads Sign in to save and opens the sign-in dialog; after you sign in, reload the calculator, run the projection again and save it.
Arriving with your choice already made
Several pages link into the calculator with part of the form filled in:
- Calculate ROI → next to a school on a career's detail page, and the calculator links on comparison results for careers, open the calculator with the school, degree, level and career all chosen. Steps 1 to 3 are replaced by a short summary (Career, Degree, University) and the page scrolls to Step 4. You check the inputs and click Run 20-Year Projection. ↺ Change selection brings Steps 1 to 3 back.
- Calculate ROI → on a degree's detail page, Open in ROI calculator on degree comparisons, and the program chips on a school's program page choose the school, degree and level. The career is left to you, and the page says: Degree and university are prefilled. Select a career below, then drill down to run the ROI calculator. Graduate links open at level Graduate.
- Run the numbers for this degree → on the Degrees page types the degree's name into the degree search for you, so its dropdown opens.
- Run the numbers → on the Careers page adds a line above the degree search, Suggested career for Step 3: followed by the career's name. Nothing is selected; it is a reminder for when you reach Step 3.
- A saved run from My Reports reopens with the school, degree, level and career chosen and calculates straight away (see Common questions).
If a link points to a school or program the calculator cannot find, you see Could not prefill the selected university from compare results. or Could not find the selected degree program at this university. and can pick by hand.
Every control explained
| Control | Where | What it changes | Default | Tips |
|---|---|---|---|---|
| Showing data for | Top of the page | The state whose schools, programs, tuition, wages, rents and postings the calculator uses. | Your last choice; none on a first visit (the page asks you to pick) | Changing it reloads the page for the new state; start the form again. |
| Degree level | Step 1 | Which programs appear in Step 2 and in the degree search: All, Undergraduate or Graduate. With a school chosen, changing it reloads that school's programs. | All | With All, each program is run at its own level. |
| University type | Step 1 | Filters the school list and the degree-search results to Public, Private (nonprofit), Community College or For Profit. | All | Changing it clears the school you had chosen. |
| Residency | Step 1 | Which tuition the run uses: in-state or out-of-state. Changing it refreshes the tuition shown in Step 4. | In-state | The tuition buttons in Step 4 switch the same setting. The note under the box reads If out-of-state tuition isn't published, enter it below. The calculator never uses the in-state price instead (see Common questions). |
| University search | Step 1 | Chooses the school. Type part of a name or a common nickname; clicking the box with nothing typed lists every school. Up to 30 matches, shown as name and city. | Empty | Names that start with what you typed come first, then names that contain it, then city matches. No universities found means nothing matched the text and the type filter. |
| × (Clear selected university) | Inside the University box | Clears the school and everything after it. | Hidden until you type or pick | Emptying the box by hand does the same. |
| Universities list | Step 1, below the search box | Another way to choose a school: click a tile. Tiles show name, city and type, alphabetically, filtered by what you type. | Every school with published in-state tuition | After you pick, the list shows only your school. No universities match your search. means the filters left nothing. |
| Degree search (Or search by degree across all … universities) | Step 1 | Searches program names at every school in your state. Picking a result chooses both the school and the program and jumps to Step 3. | Empty | Needs at least two letters. Up to 30 results, most-graduated programs first. A tag may read Broad Program, Other In Field or Preparatory. Messages: No programs found., No programs found at universities matching both filters. |
| × (Clear degree search) | Inside the degree search box | Empties the degree search box. | Hidden until you type | It does not clear a school or program you already chose. |
| When university & degree both typed: Either matches / Both must match | Step 1, beside the degree search | With Both must match, degree results are limited to schools whose name or city contains the text in the University box. | Either matches | Useful for "nursing at a school in this city". |
| Search programs offered at this university | Step 2 | Filters the program chips by name. | Empty | No programs match your search. when nothing fits. |
| Program chips | Step 2 | Click one to choose the program and load its careers. Each shows the program name, credential level and graduates per year (— when unknown), and sometimes a tag such as Broad Program. | None chosen | A notice may appear above the chips, beginning Low-confidence mapping. when the link from program to careers is loose. |
| × Clear degree | Step 2 header | Clears the program and everything after it. | Hidden until a program is chosen | The school stays chosen. |
| Graduate degree only — I already have an undergrad (e.g., international student) / Stack with a … undergrad degree — show combined ROI | Step 2½ (master's and doctoral programs only) | Whether to run the graduate degree alone or together with an earlier degree. | Graduate degree only | Stacking runs one projection per degree with the same financing, living and assumption inputs. |
| Undergrad Degree: University | Step 2½, after choosing to stack | The school of the earlier undergraduate degree. | The school you chose in Step 1 | The empty box reads Same university or search universities…; it searches your state's schools. Up to 20 matches. |
| Undergrad Degree: Program | Step 2½ | The earlier undergraduate program. Click the box to see up to 25 programs; type to narrow. | Empty (inactive until a school is set) | The pick is confirmed as Selected: followed by the program and level. The stack runs only once this is set. |
| Master's Degree (optional): Skip — calculate without stacking a master's / Include a Master's degree in the stack | Step 2½ (doctoral programs only) | Adds a master's degree between the undergraduate degree and the doctorate. | Skip | Including it shows its own University and Program boxes, which work like the undergraduate pair. |
| Master's University | Step 2½ | The school of the master's degree in the stack. | Empty | The box reads Search universities…; type to search your state's schools. |
| Master's Program | Step 2½ | The master's program in the stack. | Empty | Lists graduate programs only. |
| − Hide list / + Show list | Step 3 header | Folds or unfolds the career tables. | Shown; folds itself after you drill down | Unfold it to try another career. |
| Column headers Career / Occupation, Median Salary, Entry Salary | Step 3 tables | Sort the table: first click ascending (↑), second descending (↓), third back to the original order. | Original order | Each table sorts on its own. |
| ⓘ (Salary source info) | Each career row | Opens a note: next degree needed, path notes, and Salary source: with the source, year, area and confidence. | Closed | Click anywhere else to close it. |
| Drill down → | Each career row | Chooses the career and opens Step 4. | None chosen | On an advancement-path career, hover to read how the calculator models it (see Reading the results). |
| ↺ Change selection | Summary bar shown when you arrive with a career already chosen | Brings Steps 1 to 3 back so you can change the school, degree or career. | Shown only after such a link | Your current choices stay in place. |
| × Clear career | Step 4 header | Clears the career and hides Step 4 and the results. | Hidden until a career is chosen | The school and program stay. |
| About this rating | AI Outlook block, Step 4 | Expands the AI Outlook detail: a year-by-year table (Year, P(substituted), 80% CI), Top exposed tasks: and Sources:. | Closed | Not every career has a rating yet. |
| Tuition buttons In-state / Out-of-state | Step 4, after Annual tuition — click to switch: | Switch residency without scrolling back to Step 1; the Step 1 Residency box changes with them. | Matches Step 1 | A button reading not available cannot be clicked. When both prices are equal, one figure shows with (same for all residencies — private institutions don't charge by state). |
| Manual annual tuition ($) | Step 4, only when the school has no tuition data, or when Residency is out-of-state and the school publishes no out-of-state tuition | Supplies a yearly tuition so the run can go ahead. | Empty | Whole dollars, up to $200,000. Until you fill it, the run button reads Enter Tuition To Continue. |
| Own savings / scholarships ($) | Financing | Money you put in from savings, family or scholarships. It lowers the loan the calculator assumes. | 0 | Up to $2,000,000. |
| Manual tuition loan (blank = auto) | Financing | Sets the tuition loan yourself. Living costs during school that your earnings and savings don't cover are still borrowed on top of it. | Blank (the calculator sizes the loan) | Blank means: the school's typical student debt or the education cost, whichever is lower, minus savings and in-school earnings. With no typical-debt figure, the full education cost minus those. |
| Loan repayment term (years) | Financing | How many years after graduation you repay the loan. | 10 | 1 to 30. The interest rate is not an input; the run shows it as Loan Interest Rate under Assumptions Used. |
| In-school earnings: School year 1, School year 2 … | Financing | What you expect to earn in each school year (part-time work, internships, assistantships, fellowships). | 0 each year | One box per school year: the program's usual length plus any extra years the career needs. |
| Include living expenses / Education costs only | Living Expenses | Education costs only sets rent and living costs to zero for every year and hides the boxes below it. | Include living expenses | The monthly total then reads $0/mo. |
| During-school city | Living Expenses | The city whose rent is used while you are in school. Type part of a name; up to 20 cities show with their monthly rent. | The school's city | Every state has a city list (see Reading the results). No cities found means no city in your state's list matches. Your pick shows as ↳ School city: with a student-adjusted rent. |
| Post-graduation city | Living Expenses | The city whose rent is used after you graduate. | Same as the school city | Your pick shows as ↳ Post-grad: with the city's rent after the student adjustment, the figure the run uses. The line under the box says Doesn't change the degree vs. no-degree comparison.: it changes the Net With Degree and Net Without Degree columns and the housing figures shown, but not the Incremental Net, the Cumulative ROI or the break-even year, because both paths pay the same rent after graduation. |
| Rent (during school) | Living Expenses | Housing cost while in school: University dorm (default), Shared apartment (~½ market), Market rent (HUD estimate), Live with family / relatives ($0), or Enter monthly amount… (opens a box, up to $10,000). | University dorm (default) | A hint under the box shows the monthly figure. After graduation the calculator always uses market rent for the post-graduation city. |
| Living expenses (food, transit, etc.) | Living Expenses | Everything except rent: Auto (based on school city), Lean — about $500/mo, Standard — about $800/mo, Comfortable — about $1,500/mo, or Enter monthly amount…. | Auto | Lean, Standard, Comfortable and a custom amount are sent as one monthly total that the calculator splits 45% housing and 55% other costs for every year; with them, the Rent choice no longer drives the run. |
| Monthly total (rent + living): | Living Expenses | Read-only: the rent figure plus the living figure for your choices. | — until a program is chosen | With dorm and Auto together, the meals already inside the dorm price are taken out of Auto so food is not counted twice. |
| Scenario | Assumptions | User-entered rates uses your raise and bump; Conservative uses a 1.5% raise and 4% bump; Optimistic a 4% raise and 10% bump; Simulate all three runs all three side by side. | User-entered rates | The note Projection horizon is fixed at 20 years. sits below it. |
| Annual raise (%) | Assumptions | Yearly pay rise in the degree path, from your second working year on. | 2.5 | 0 to 20. |
| Promotion bump (%) | Assumptions | Extra pay rise in each promotion year, applied after that year's raise. | 7.5 | 0 to 50. |
| Promotion years | Assumptions | Which working years get a promotion, counted from your first year after graduation. | 4, 8, 12 | Up to eight whole numbers from 1 to 20, separated by commas. Empty or out of range: Enter at least one promotion year between 1 and 20. |
| Run 20-Year Projection | Bottom of Step 4 | Runs the projection and shows the results. | Active once a career with pay data is chosen | Reads Enter Tuition To Continue or Projection Unavailable when it cannot run, Calculating… while running, and Calculating 2 degrees… or Calculating 3 degrees… for a stack. |
| View by degree tabs | Top of the results (stacked runs only) | Combined Stack shows totals; one tab per degree (for example Undergrad: or Master's: followed by the program) shows that degree's full results. | Combined Stack | See Reading the results for what the Combined Stack tab shows. |
| Card headings (Incremental ROI Summary, Assumptions Used, Scenario Comparison, Year-by-Year Breakdown, and the cards below them) | Results | Click a heading to fold or unfold that card. | All unfolded | Folding is only for reading comfort; nothing is recalculated. |
| Edit Assumptions Above | Assumptions Used card | Scrolls back up to Step 4. | — | — |
| Recalculate | Assumptions Used card | Scrolls to Step 4 and runs the projection again with the current inputs. | — | Use it after changing any input. |
| See where these postings come from | Currently Active in … card | Opens Jobs Trends. | — | The card shows only when there are enough postings. |
| ? About these numbers | Salary comparison card | Expands a short explanation of posted pay versus survey pay. | Closed | — |
| ☆ Save this report / ★ Saved / Sign in to save | Floating button, bottom right, once results show | Signed in: saves this run to the 📊 ROI Calculator section of My Reports; clicking ★ Saved removes it again. Signed out: reads Sign in to save and opens the sign-in dialog. | Hidden until results show | Each new run shows ☆ Save this report again, so you can save several runs (up to 5). See Saved reports. |
| Save as PDF | Floating button, bottom right | Opens your browser's print dialog; choose "Save as PDF" there to keep a copy. | Always shown | The printout carries a watermark and leaves out the menus and buttons. |
Reading the results
How the projection works, in plain words
The calculator follows two people for 20 years. One goes to school for the length of the program and then works in your chosen career. The other starts work in year 1 without the degree. Each year it subtracts loan payments and living costs from each person's income and records the difference. That difference is the Incremental Net. Adding those differences up year by year, and subtracting the part of the degree's cost you pay without borrowing (savings, scholarships or in-school earnings), gives Cumulative ROI. The part paid with the tuition loan is not subtracted again: it is already counted through the loan payments, interest included. The break-even year is the first year after graduation in which that running total reaches zero.
While you are in school, the rent and living costs that your in-school earnings and leftover savings or scholarships don't cover are borrowed on the degree path. They are added to your loan, build up interest until you graduate, and are repaid with the tuition loan. The person without the degree pays the same living costs from wages. So a cheaper or dearer place to live during school changes your debt, your monthly payment, the Incremental Net, the Cumulative ROI and can move the break-even year. After graduation both people pay the same rent and living costs, so the post-graduation city changes the Net columns but not the comparison.
Step 3: the career tables
| Item | Meaning | Unit | Source and year | How it is computed |
|---|---|---|---|---|
| Direct Careers | Careers this program leads to straight after graduation. | — | The federal program-to-career crosswalk (NCES and BLS), with site corrections | The Pathway column says Direct, or names a licence (Requires …, Requires licensure, Direct — … recommended). |
| Careers Requiring Graduate Study / Licensure | Careers that need a further degree or licence. | — | Same crosswalk | The Next Step column names the next credential, or reads Bridged, Grad + … or Grad / License. Extra years of study are added to the time in school. |
| Career Advancement Pathways | Senior roles usually reached 5 to 15 years after entry, not first jobs. | — | Same crosswalk | When you drill into one, the projection starts at the pay of its usual entry-level role and a banner above the results names both roles. |
| Not Precise Enough For Salary Modeling | Links that are too broad to model, shown so the gap is visible. | — | Same crosswalk | Columns Why It Is Not Modeled and What This Means. These rows have no drill-down. |
| Median Salary | Middle pay of everyone working in the career. | Dollars a year | BLS Occupational Employment and Wage Statistics (OEWS), May 2024, for your state; the ⓘ note names the source used | The 50th percentile. If your state has no figure, the next source in line is used and labelled: earlier state data, national data, or a related-careers estimate. |
| Entry Salary | Pay near the start of a career. | Dollars a year | Same | The 25th percentile: a quarter of workers earn less. |
| — | No usable figure. | — | — | A career with no pay data can be viewed but not projected (Projection Unavailable). |
If the program has no linked careers you see No career mapping is available for this degree program yet.
Step 4: Outcome Overview
| Item | Meaning | Unit | Source and year | How it is computed |
|---|---|---|---|---|
| AI Outlook | A research-based rating of how much of the career's work AI could do or help with, with a short explanation. | A label; percentages of task time in the detail | Published research, named on the Sources: line | From a hand-built catalogue. Careers not yet rated show AI-impact rating is not yet available for this entry. The percentages describe task time, not job losses. |
| Selected Career | The career you picked, by name. | — | — | — |
| Median Salary / Entry Salary | As in Step 3. | Dollars a year | OEWS, May 2024 | 50th and 25th percentiles. |
| Pathway | Direct career, a licence (Requires …), or the next credential needed. | — | Crosswalk | — |
| Projected growth in … | Expected change in the number of jobs over ten years, and openings each year. | Percent; openings a year | Your state's long-term projections (2022–2032 in most states, 2024–2034 in New York and Hawaii); if your state has none, the BLS national projections, 2024–2034 | The label names the area and the years. Hidden when neither exists. |
| Selected Career Salary Profile | Two bars: Entry Salary and Median. | Dollars a year | OEWS, May 2024 | Bar heights are relative to the larger figure. |
| Annual tuition | One year's published tuition, in-state and out-of-state. | Dollars a year | U.S. Department of Education College Scorecard, latest release loaded for your state; IPEDS as a fallback for in-state | Published sticker price, before aid. |
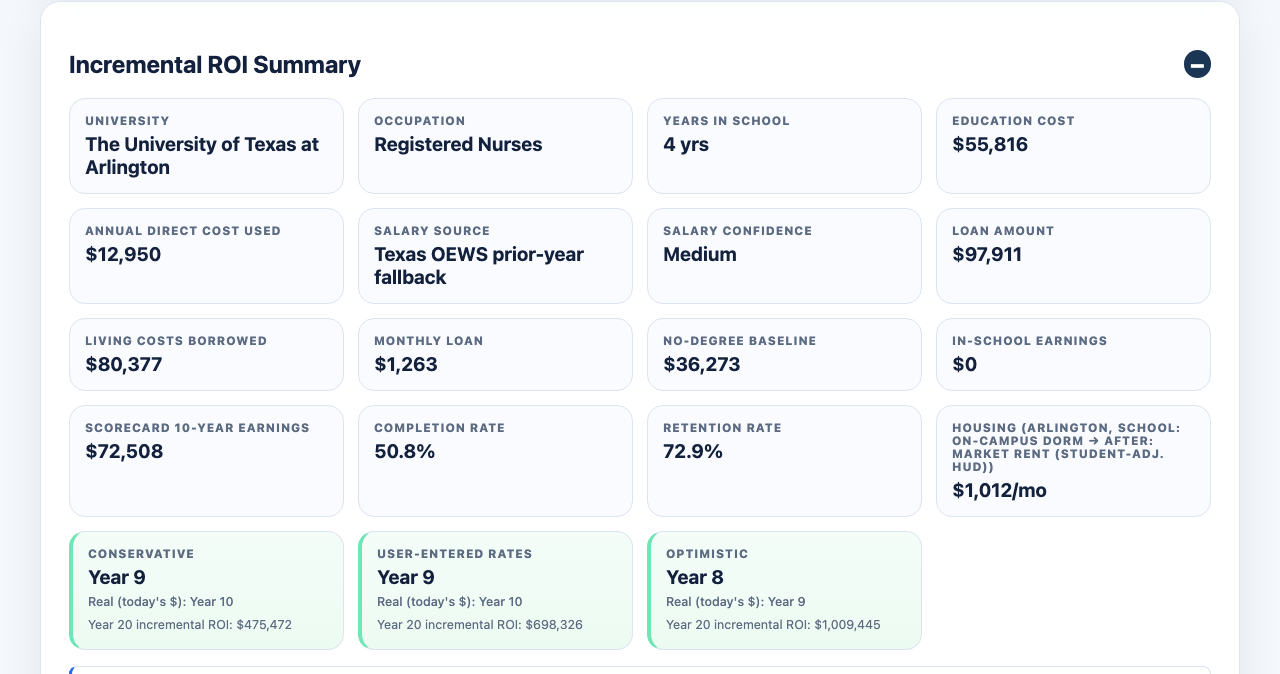
Incremental ROI Summary
| Item | Meaning | Unit | Source and year | How it is computed |
|---|---|---|---|---|
| University / Occupation | The school and career you ran. | — | — | — |
| Years in School | How many school years the run used. | Years | The program's level; the career's pathway | Two for an associate's or master's, four for a bachelor's or a professional doctorate, five for a research doctorate. When the career needs more schooling after this degree (for example a master's after a bachelor's), the extra years are added and named, as in 6 yrs (4 for this degree + 2 more the career needs); the School year boxes in Financing follow the same count. |
| Education Cost | Total direct cost of the degree. | Dollars | College Scorecard tuition plus books and supplies | One year's direct cost, raised 5% each later year (a rule of thumb for tuition growth), added up over the years in school. |
| Annual Direct Cost Used | One year of tuition plus books and supplies, for the residency used. | Dollars a year | College Scorecard | Tuition only when books and supplies are missing; your manual tuition when you entered one. |
| Salary Source / Salary Confidence | Which wage table the entry pay came from, and how much to trust it. | — | OEWS May 2024 or the labelled fallback | Confidence reads High, or lower for fallbacks. |
| Loan Amount | Everything you borrow: the tuition loan plus the living costs borrowed during school. | Dollars | Your tuition-loan input, or College Scorecard median debt; your rent and living choices | See Manual tuition loan in the controls table. |
| Living Costs Borrowed | The part of Loan Amount that pays rent and living costs during school. Shown only when it is above zero. | Dollars | Your rent and living choices, in-school earnings and savings | Each school year's rent and living costs, minus that year's in-school earnings, minus savings or scholarships left after tuition; the rest is borrowed. |
| Monthly Loan | Your monthly payment after graduation. | Dollars a month | Federal Direct Loan rate for the 2024–25 school year (undergraduate or graduate) | Interest builds up while you study: on the tuition loan for half the years in school, and on each year's borrowed living costs from the middle of that year until you graduate. The whole balance is then repaid in equal monthly payments over your term. The rate is shown under Assumptions Used and cannot be changed. |
| No-Degree Baseline | Yearly pay in the path without the degree. | Dollars a year | Census Bureau American Community Survey, 2023 five-year estimates, statewide median earnings | High-school graduates' earnings for undergraduate programs, bachelor's holders' for graduate programs. It grows 2% a year with no promotions. |
| In-School Earnings | Your in-school earnings added up. | Dollars | Your input | They lower the assumed loan and count as income in the school years. |
| Scorecard 10-Year Earnings | The school's median earnings about ten years after students started. | Dollars a year | College Scorecard | Shown for context only; not used in the projection. |
| Completion Rate / Retention Rate | Share of students who finish; share who return for a second year. | Percent | College Scorecard | Context only. |
| Housing (…) | Monthly rent used after graduation; the label names the city and housing type. | Dollars a month | HUD Fair Market Rents | See the rent notes below. |
| Scenario card (User-Entered Rates, Conservative, Optimistic) | The break-even year: Year N, or Beyond window if it does not happen within 20 years. | Year number | — | First year after graduation in which the running total of Incremental Net (loan payments included) reaches the part of the Education Cost not covered by the tuition loan. |
| Real (today's $): Year N | The break-even year after inflation. | Year number | BLS Consumer Price Index | Each year's Incremental Net is shrunk back to today's dollars by the inflation rate before adding up. It is the same as or later than the plain-dollar year, and is missing if it does not happen in 20 years. |
| Year 20 incremental ROI: | The Cumulative ROI at the end of year 20. | Dollars | — | Negative means the degree has not yet paid back by then. Card colours go from green (early break-even) to red (no break-even and a negative total). |
How this projection handles inflation sits under the grid. It states the yearly rate for living costs (from the BLS Consumer Price Index, average of the last five years, or 3% when that is not available) and the 5% yearly tuition rate. What These Terms Mean repeats the definitions above in full sentences.
If you drilled into a senior role, a banner above the results reads Modeled as …, the typical entry path to …. It explains that year 1 uses the entry-level role's pay and that raises and promotions grow it from there.
Assumptions Used
A record of everything the run used: Projection Horizon (20 years), Scenario Selection, Scenario Rates, Promotion Timing, Own Savings, Loan Amount Input (Auto from tuition minus savings or your figure), Loan Term, Loan Interest Rate (the rate the run used, for example 6.53% a year, with its source and school year; read-only), In-School Earnings by year, College Scorecard Inputs (in-state and out-of-state tuition, books and supplies, average net price, median debt, and Residency used:), Occupation Salary Inputs (source year, area, confidence, reason, method), Housing Assumption, Housing City and Housing Figures Used (rent, living and total per month). Check it before you share a result.
Scenario Comparison (the charts)
A colour key names each scenario (blue for User-Entered Rates, amber for Conservative, green for Optimistic). Cumulative Incremental ROI plots the running Cumulative ROI for years 1 to 20; the point where a line crosses zero is the break-even year. Annual Incremental Net plots each year's Incremental Net: below zero in the school years, then rising after graduation, with a dip while loans are repaid. Both use dollars on the side axis and years 1, 5, 10, 15 and 20 along the bottom.
Year-by-Year Breakdown
With one scenario the table is titled Year-by-Year Incremental ROI Breakdown and has 20 rows:
| Column | Meaning | Unit | How it is computed |
|---|---|---|---|
| Year | Year 1 to 20. A ✓ marks years after the loan is paid off. | — | — |
| Phase | School or Post-grad. | — | School for the program's years plus any extra years the career needs. |
| With Degree Income | Your pay in the degree path. | Dollars | In-school earnings during school; then entry pay, with your raises and promotions. |
| Without Degree Income | Pay in the no-degree path. | Dollars | The No-Degree Baseline, growing 2% a year. |
| Loan Payment | Loan repaid that year. | Dollars | Twelve monthly payments, for the years of your term. |
| Net With Degree | What is left in the degree path. | Dollars | Income minus loan payment, rent and living costs (living costs rise with inflation each year). During school, the living costs that are borrowed or paid from savings are not taken from that year's income; they come back as loan payments after graduation. |
| Net Without Degree | What is left in the no-degree path. | Dollars | Income minus the same rent and living costs. |
| Incremental Net | The degree's gain or loss that year. | Dollars | Net With Degree minus Net Without Degree. Rows are tinted by its sign. |
| Cumulative ROI | Running result so far. | Dollars | Sum of Incremental Net to date minus the part of the Education Cost not covered by the tuition loan. The borrowed part is counted once, through the Loan Payment column. |
With Simulate all three the table is titled Scenario Comparison Table and shows, for each scenario, an Incremental and a Cumulative ROI column.
Rent and living costs
- City rents are HUD Fair Market Rents for a one-bedroom home, in 2023 dollars. In Texas the list is the state's metro table for 2023. In every other state the list holds the cities where your state's schools are, at the latest year the price index covers, converted to 2023 dollars; a city with no college is not listed.
- Student adjustment. Fair Market Rents describe a typical renter. Students tend to rent cheaper places, so city rent is multiplied by 0.82, during school and after graduation alike; the hints, ↳ Post-grad: included, show the adjusted figure and say student-adjusted.
- Dorm uses the school's reported room and board (it includes meals) divided by twelve. Shared apartment is half of market rent.
- Auto living costs start from a basic-needs budget for the school's area, take out housing, and scale the rest (food, transportation, health care, personal) down to a student budget. When that budget is missing, $800 a month is used.
- Living costs rise each year by the living-cost inflation rate.
Cards at the bottom
- Currently Active in … (your state's name): Currently N active postings in … with the date range, Top metros: and Top employers:, from the site's sample of public job postings. It shows only when at least 30 postings match the career.
- Salary Comparison: Posted vs BLS vs ROI Model: a Source / Median table with Modeled — Year 1 entry salary (this calculator's projection) (your first working year's pay after graduation, the same figure as the first Post-grad row of the Year-by-Year table), the OEWS median for your state (or the first listed metro area), May 2024, and the median pay advertised in active postings when at least 30 of them list pay. Sentences compare them (for example Posted salaries are in line with the BLS median. and Modeled Year 1 salary is …% of the BLS median).
- Could Housing Choices Improve ROI?: shown when break-even is later than year 10 or never. Three cards (With parents during school, Shared housing throughout, With parents during school + shared after) each show a break-even year and the rents used. Cheaper housing during school means less to borrow, so a card can show an earlier break-even year than your main result.
Stacked runs
With a stack, the View by degree tabs appear. Each degree's tab shows that degree's full results, run on its own with your shared inputs. The Combined Stack tab lists Total Degrees, Total Years in School and Total Education Cost (each degree's years and Education Cost added up), Target Career Salary (first working year's pay after the last degree) and each degree's break-even year, plus the Degree Stack path, the Career and one line per degree with its years in school and Education Cost.
For sources and methods across the site, see how the figures are produced.
Worked example
A parent in Ohio wants to know whether a nursing degree at a public university in the state pays back, for a daughter who will live in a dorm and has some scholarship money.
- She sets Showing data for to Ohio. The page header and labels now name Ohio.
- She sets Degree level to Undergraduate, sets University type to Public and keeps residency on in-state.
- She types "nursing" into the degree search. A dropdown lists nursing programs at Ohio's public universities, the most-graduated first, each with school and city. She clicks the program at the school her daughter likes.
- The school and program are now chosen, and Step 3 shows careers. A nursing career sits under Direct Careers with its pathway, a median and an entry salary in dollars a year. She clicks Drill down →.
- Step 4 shows the two salaries, the pathway, a projected-growth figure for Ohio with the years in the label, an AI Outlook block, and the annual tuition with an in-state and an out-of-state price.
- She enters the yearly scholarship total times four in Own savings / scholarships ($), leaves the loan on auto and the term at 10 years, and adds a modest summer-job figure to School year 2 and School year 3.
- She keeps University dorm (default) and Auto. The monthly total shows a dollar figure per month, and the Auto hint says the dorm meals were taken out.
- She sets Scenario to Simulate all three and clicks Run 20-Year Projection.
- The summary shows the Education Cost in dollars, a loan amount and a monthly payment, the no-degree baseline, and three cards: each with a break-even year, an after-inflation year, and a Year 20 total in dollars. The Conservative card breaks even no sooner than the others.
- The charts show three lines that dip below zero for the four school years, then climb; she reads where each crosses zero. The Scenario Comparison Table gives the same numbers year by year.
- To see out-of-state pricing for a school across the border, she would change states and repeat. To compare a second Ohio school, she clears the school, picks another, and runs again with the same inputs.
- Signed in, she clicks ☆ Save this report. The run is in My Reports and will reopen with this school, program, level and career, recalculated, with the other inputs back at their defaults.
Common questions
- Why can't I find my school?
- The list holds only schools in the state chosen in Showing data for that publish in-state tuition. Check the state, clear University type, and try the degree search. Schools without tuition data are listed on Schools without tuition data. If you pick a school that turns out to have no program rows, the page says This school is listed in the source data, but it has no degree-program rows for the calculator yet. and removes it for this visit.
- What happens with out-of-state tuition when the school doesn't publish it?
- The Out-of-state tuition button reads not available. The calculator does not swap in the in-state price. With residency set to out-of-state, the tuition box opens under the prices with Out-of-state tuition isn't published for this school., and the run button reads Enter Tuition To Continue until you type the yearly out-of-state tuition (from the school's own website, for example). Or switch to in-state, or choose another school. A figure left in the box is not used once you switch back to in-state. Private schools usually charge everyone the same, and the page then shows one price with (same for all residencies — private institutions don't charge by state).
- Why does a salary or a rate show "—"?
- The source has no figure for that career or school. A career with no pay figure cannot be projected (Projection Unavailable). A missing completion rate, retention rate or 10-year earnings only affects the summary, not the projection.
- Why is there no projected-growth tile?
- It appears only when your state or the U.S. projections cover that career. When your state has no figure, the U.S. figure is shown and the label says "the U.S.".
- How do rent and living costs affect my result?
- During school, the share of rent and living costs that your in-school earnings and leftover savings or scholarships don't cover is borrowed. A higher rent during school means a bigger loan, a higher monthly payment and a lower Cumulative ROI, and it can push the break-even year later. If the change is small, the break-even year may stay the same while the dollar figures move. After graduation both paths pay the same rent and living costs, so changing the Post-graduation city changes the Net columns but not the comparison.
- Why are there two break-even years?
- The first counts dollars as they are earned. The second, Real (today's $), first shrinks later years' gains by inflation, so it is the same or later. Treat the real year as the more cautious answer.
- Why do two careers from the same degree give very different results?
- The entry pay drives the projection, and careers differ a lot. Careers that need more study add school years (more cost, later start). Senior roles are started at their entry-level role's pay, so they look slower than their median suggests.
- Can I change the loan interest rate or the 20-year horizon?
- No. The rate is the federal Direct Loan rate for the 2024–25 school year, undergraduate or graduate (6.53% for undergraduates, 8.08% for graduate students); Assumptions Used shows it as Loan Interest Rate with its source. The horizon is fixed at 20 years. You can change the loan amount and the repayment term.
- What does a saved run bring back?
- Reopening a saved run restores the school, degree, level (including All) and career, and recalculates straight away. Every other input reopens at its default: residency (in-state), savings, loan amount and term, in-school earnings, rent and living costs, cities, scenario, raise, bump and promotion years. A stacked run reopens as a single run of the target graduate degree. If you ran with out-of-state tuition or different assumptions, set them again and click Recalculate.
- Why do I see "Projection is unavailable for this career…"?
- The career is in the list but has no pay data good enough to model. You can still read its pathway; pick another career to run a projection.
- The city picker says "No cities found". Why?
- Each state's list holds only cities with a college (Texas uses its metro table). Try a nearby larger city, or leave the box empty to use the school's own area.
What this does NOT do
- It is not advice. It is an estimate from public averages; your pay, costs and timing will differ.
- It does not use financial aid, net price or your family's finances, except the savings and scholarships you type in. Tuition is the published sticker price.
- It does not model dropping out, transferring, taking longer to finish, or time out of work.
- It does not count living costs after graduation against the degree: both paths pay them. Only living costs during school, which the degree path borrows, change the comparison.
- It does not let you change the loan interest rate, the no-degree pay, the tuition growth rate or the 20-year horizon.
- It is not a job board. Posting counts are a sample used to show the market, not openings to apply to.
- It stores nothing about you. Signing in is only needed to save a run; a saved run keeps the page address, not your inputs.
- A saved run does not keep residency, financing, living-cost or assumption settings.
Related
- Open the ROI Calculator
- Saved reports: signing in, saving a run, reopening it.
- Reading comparison results and Compare degrees: where many calculator links start.
- A career's detail page and A degree's detail page: the Calculate ROI → links.
- A school's programs
- Schools without tuition data
- Jobs Trends
- Choosing a state
- Privacy and limits